Client
Verizon Wireless
My Role
Lead Designer
Art Direction
The Project
The Verizon newsletter is the largest digital CRM campaign in the company, with a send list of 13 million. The objectives include continuing customer engagement through personalized dialogues and offers, generating revenue and building loyalty through increased awareness, and providing customers with useful and relevant content that enhances their Verizon relationship.
After working on this program for years we looked at the data and saw an opportunity to segment and test the newsletter to try and increase engagement with target audiences.
The Approach
After getting buy-in from the client to run the test we locked in the KPIs we would be testing. They were to deliver relevant content Target segmented groups we can focus on relevant topics of interest
Deliver relevant content – Target segmented groups we can focus on relevant topics of interest
Increase engagement – Reach the unengaged with highly targeted content
Reduce call-in rate – Produce content that has great end-to-end UX
Increase revenue – Target persona groups with offers and information to increase revenue
Some key considerations we had in designing and testing
Build alternative creative approaches and tests to measure and optimize engagement
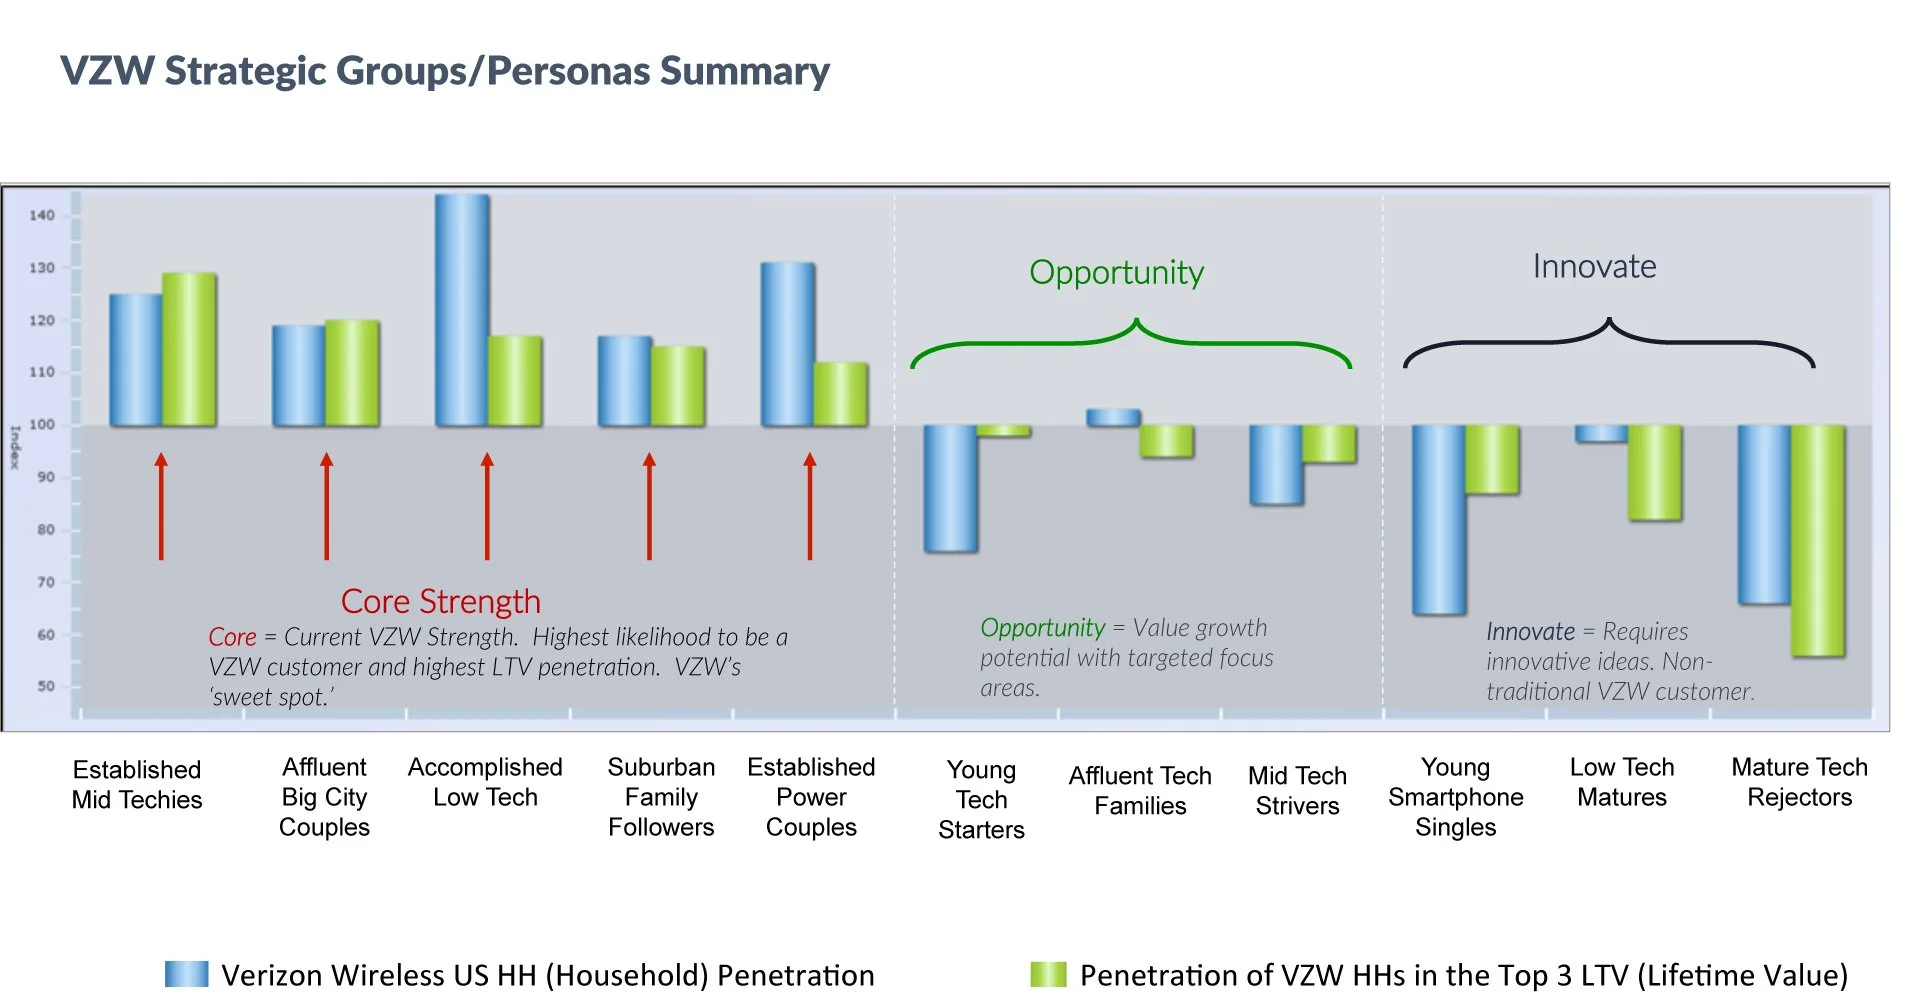
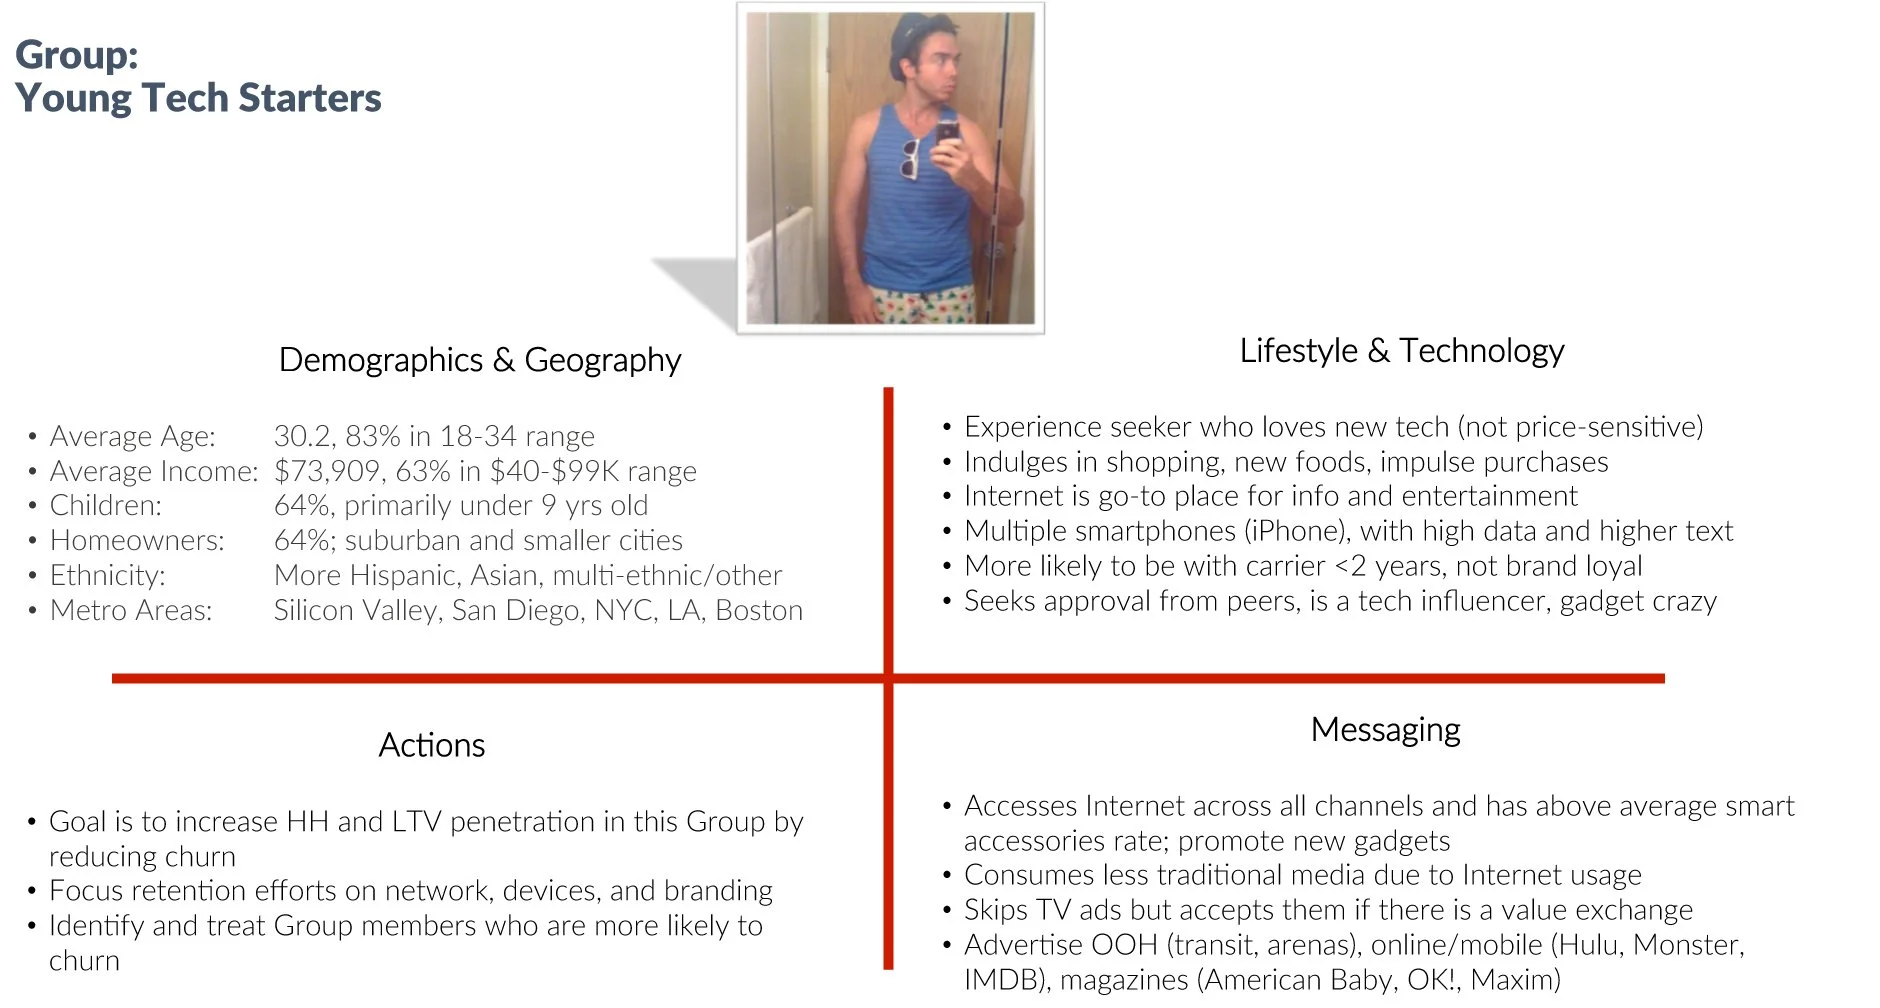
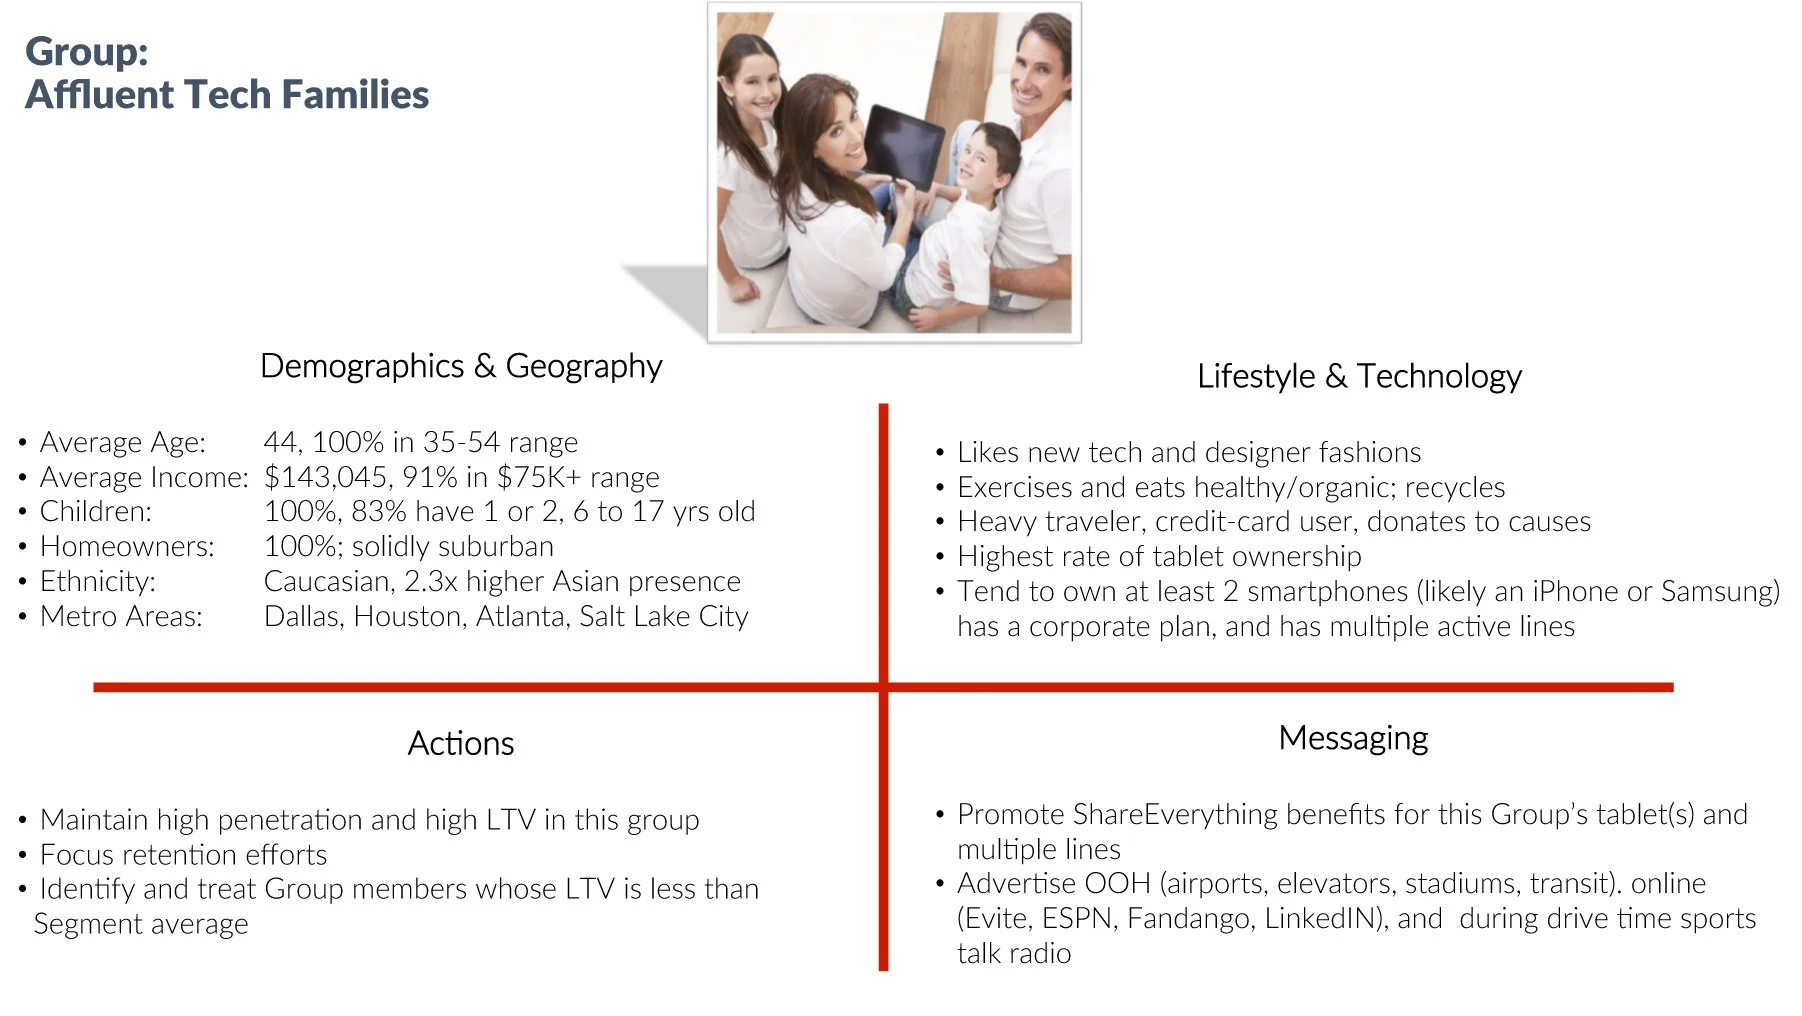
Identify customer segments and build personas based on segmentation
The creative testing strategy would be versioning the newsletter into four groups:
Engaged vs. Non-Engaged
Family vs. Non-Family
Deliver relevant content to drive higher engagement
The Planning Stage
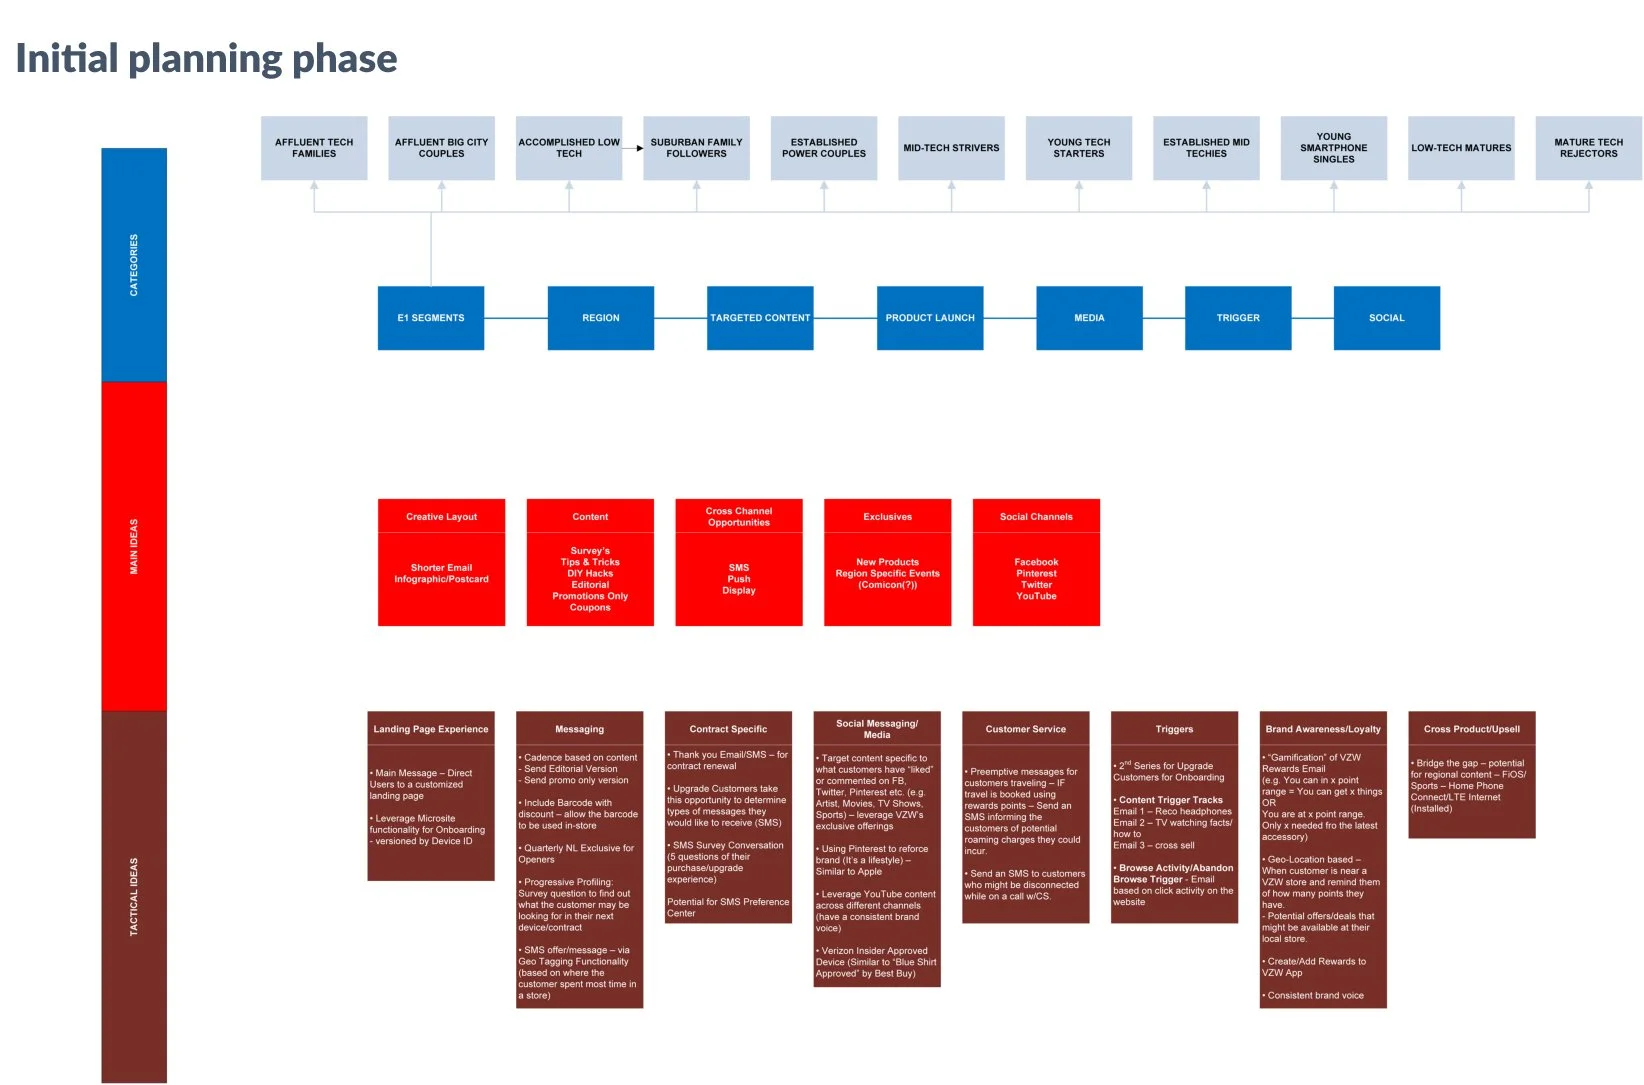
We first did a content audit of the different monthly newsletters we were sending to each segment of customers. Then we focused on our strategy on which persona groups would have the most opportunity to engage in the test. At this point in the process, we developed and analyzed the personas of all the customers in Verizon’s digital CRM.
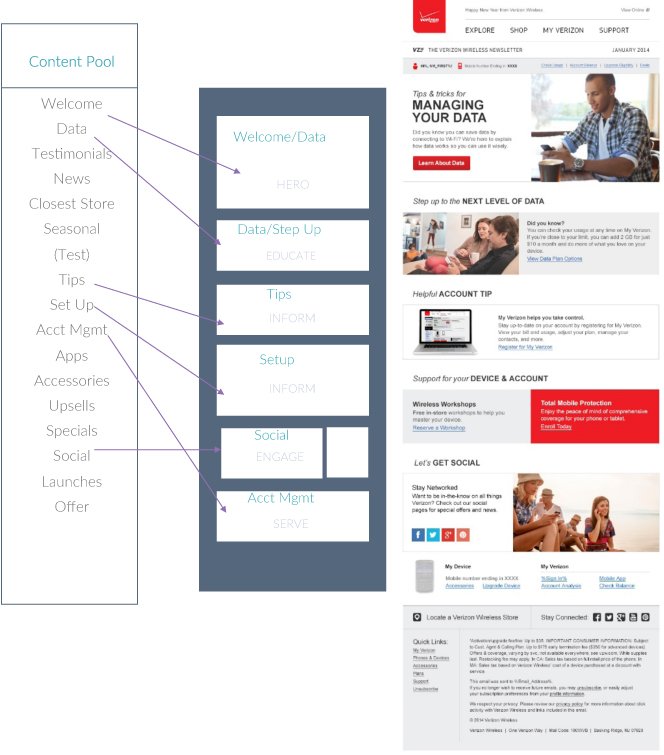
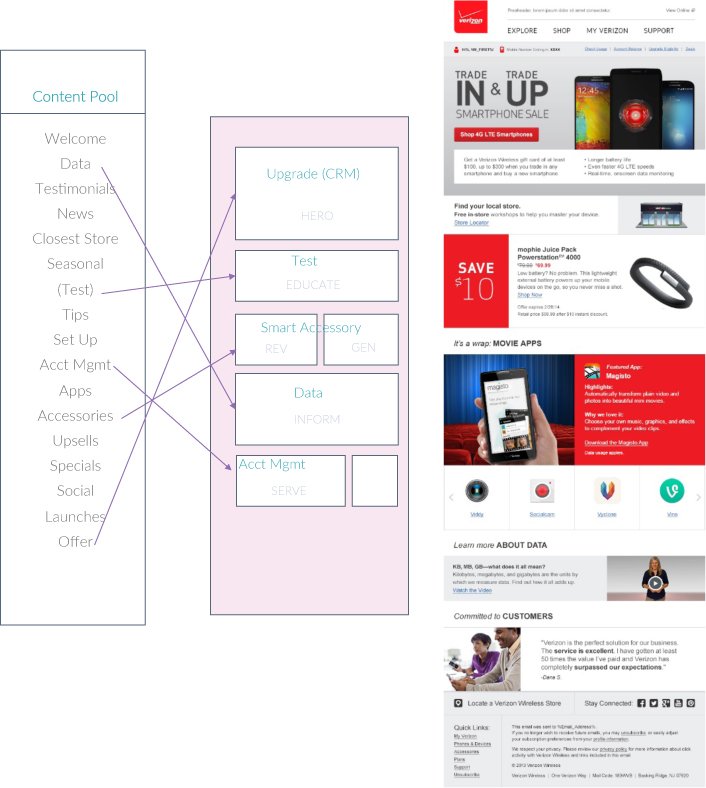
Wireframe Rounds
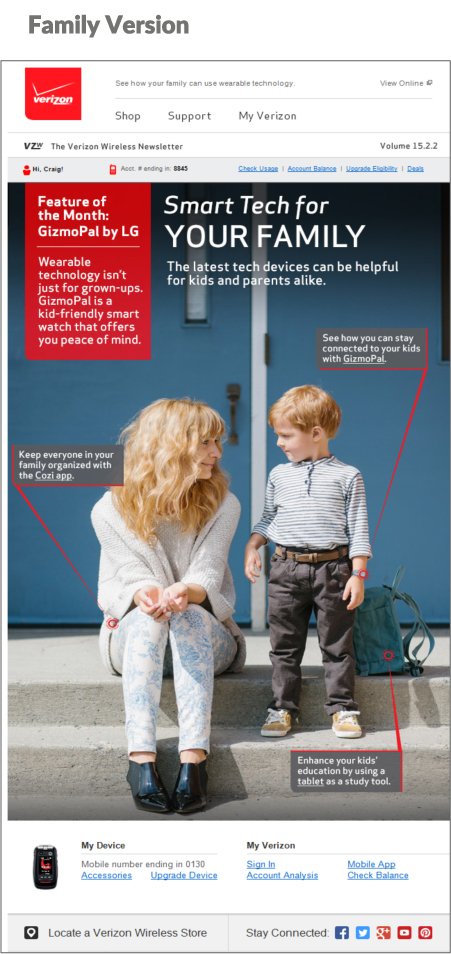
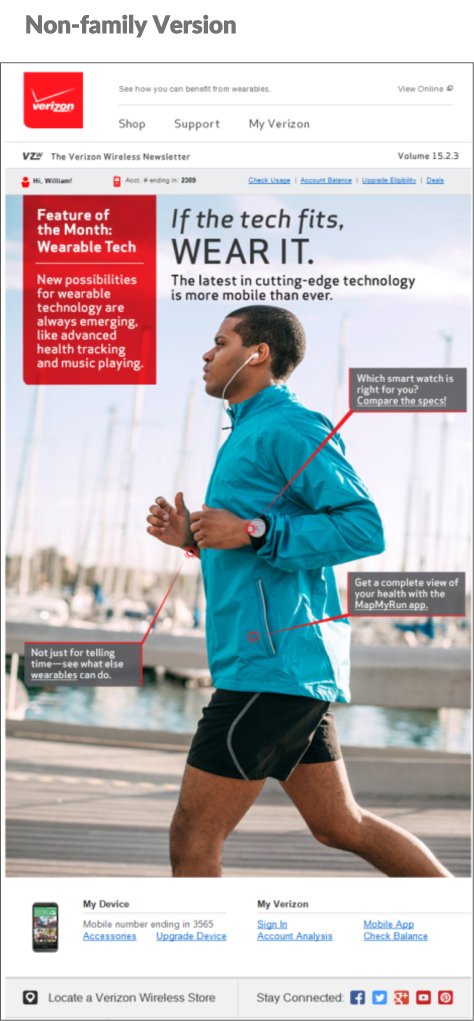
I started to work out some different ideas and layouts. After getting a few solid ideas vetted by the team, I produced low-fi mockups to present to the client. Then, I walked the client through each mockup and took notes on feedback given. Based on the client brief and business requirements we had the two versions of the NL wireframed. The non-family version was focusing on smart accessories, i.e. smartwatch, Fitbit, reviews. The family version was promoting the Cozi app, kid-friendly tablets, and a Gizmopal watch for kids. The client was having a hard time seeing the vision through low-fi mockups, but after some explaining, we got client's signed off and moved into the design stage.


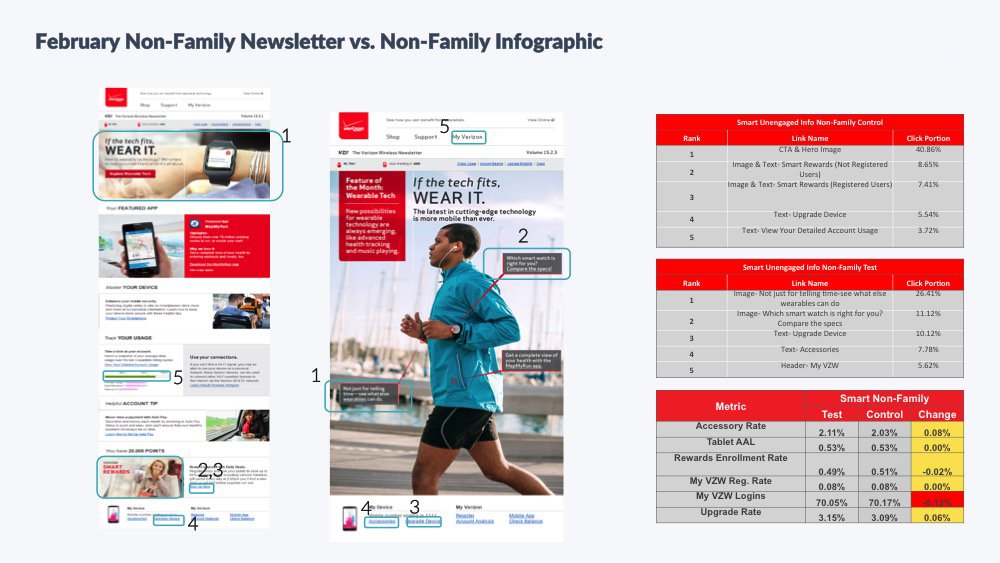
We wanted to see if a different format (i.e., infographic) would be better at engaging these customers. All of our
non-engaged recipients received an infographic (family version or non-family version depending on segmentation). The creative tests were sent to 1.8 million customers between the Family / non-family and control/test.
A total of 450,000 for each segment.
Final Designs
The Test Data
After the test ran for a month we reviewed the data and the results to help influence how we move forward and improve future tests. Even though the click-through rates might not show stellar numbers the funnel rates show that the customers that were clicking through were buying the products we advertised to them. So, in the end, we were engaging with a revenue-generating customer and the clickers were showing greater intent to buy products.

The Results
1.9 million visitors viewed Mobile Living in February.
Of total visits, 6% of visits entered the purchase funnel.
This was the highest funnel entrance rate in the past 6 months.
Organic funnel entrance rate increased 13% month over month, rising to a 10% funnel entrance rate.
The newsletter was one of the most successful traffic-driving sources for the month of February. Excluding NFL, February was the highest-trafficked month ever (1.6 million visits). The February newsletter had an average 13% funnel entrance rate.
Organic traffic for Mobile Living decreased 17% in February; organic traffic for the entire Verizon site decreased 14% for the month.
Editorial A/B testing produced actionable results in February.
The use of images increased funnel entrance rates by 19%.
The ‘Shop’ call-to-action outperformed less direct CTAs with a 27% increase in funnel entrance rate.
Articles of a shorter length increased higher funnel entrance rates by 91%.

